Swap Hunter MT4 Indicator Package For Build 1441+
$9.95
Discover the powerful Swap Hunter Indicator! Actually profitable, excited traders share secrets for better trading. Try it now for thrilling results.

Description
Swap Hunter Indicator: A Practical Guide for Correlation-Based Hedging, Swaps, and Trend Entries
Swap Hunter Indicator – Trade Smarter With the Correlation Matrix Pro
Table of Contents
- What Is the Swap Hunter Indicator?
- Why Swaps Deserve Your Attention
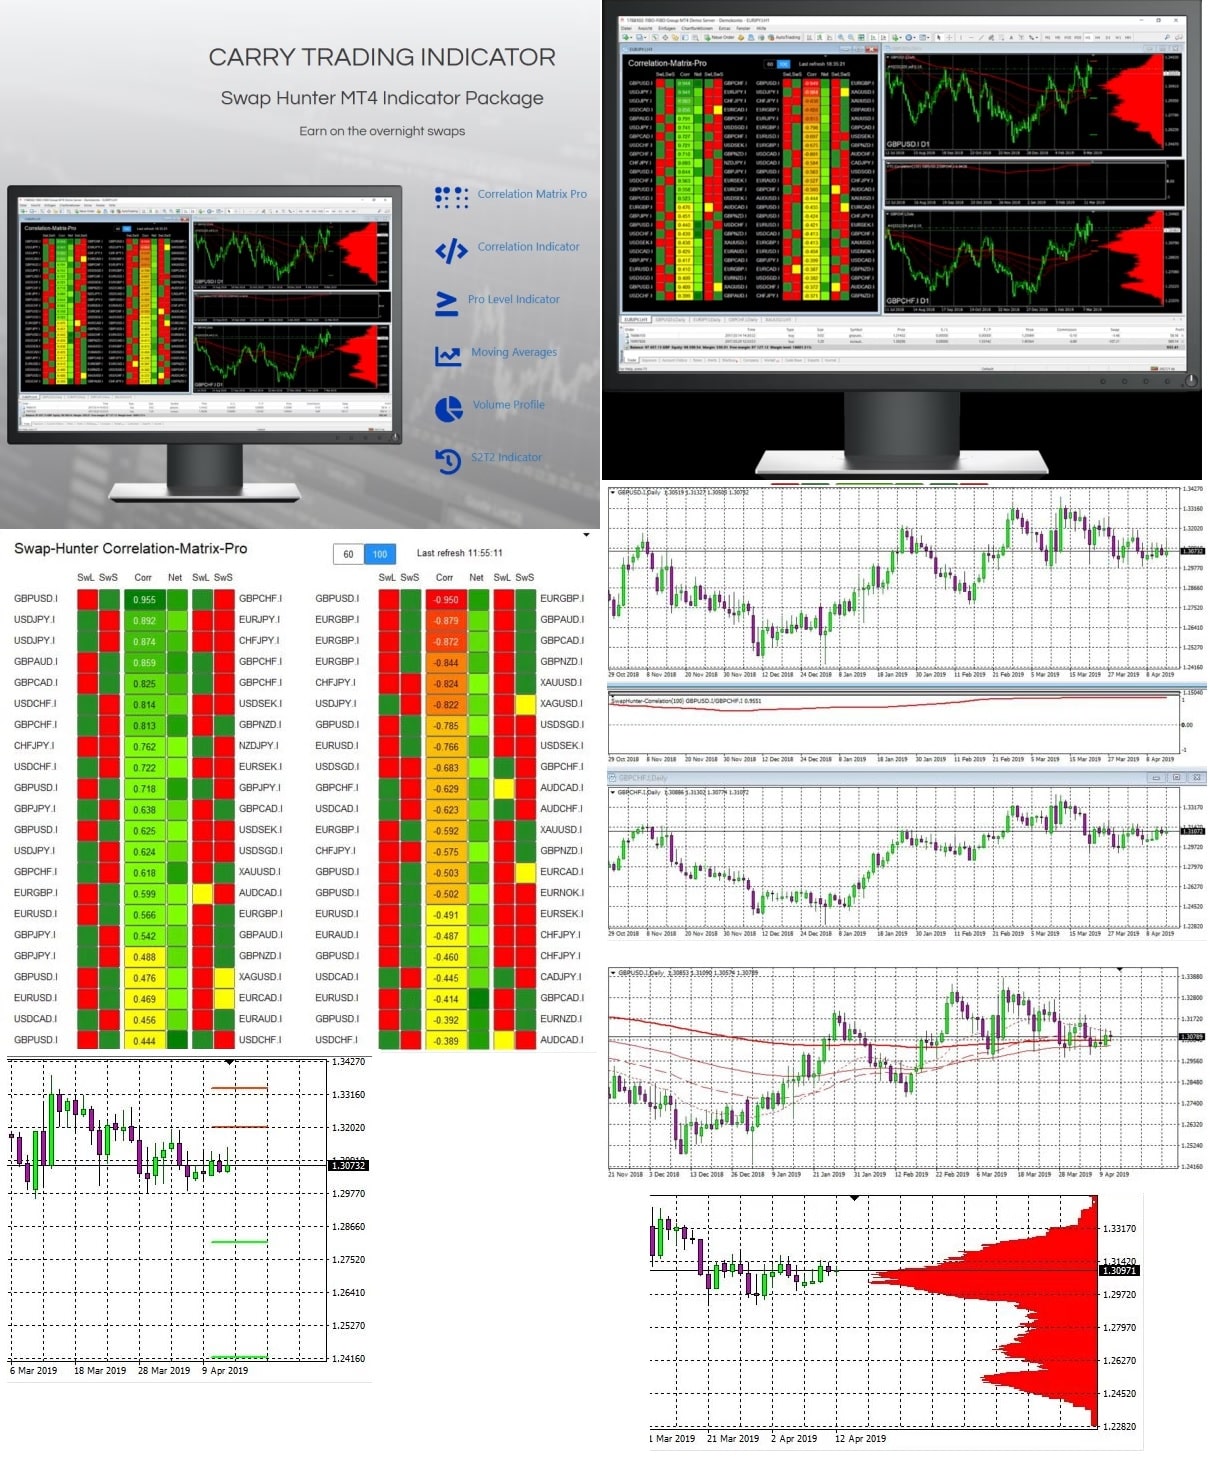
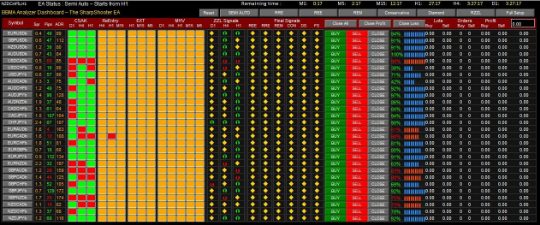
- Inside the Correlation Matrix Pro
- How To Read the Correlation, Swap Long, and Swap Short Columns
- Building a Two-Pair Hedge: Step-by-Step Example
- Swap Hunter Pro Level: Planning Entries and Exits
- Adding Context With Swap Hunter Moving Averages
- Locating Supply and Demand Zones With the Volume Profile
- S2T2: Keeping an Eye on Spread and Candle Time
- Putting It All Together: A Simple Daily Workflow
- Common Pitfalls and How To Avoid Them
- Frequently Asked Questions
- Final Thoughts
1. What Is the Swap Hunter Indicator?
The Swap Hunter Indicator is a multi-part trading tool designed for traders who want to:
- Generate steady swap income at the broker’s daily rollover.
- Hedge positively and negatively correlated asset pairs.
- Time entries and exits with clear support, resistance, and trend signals.
The heart of the package is the Correlation Matrix Pro. It scans dozens of forex, index, commodity, and crypto pairs, ranks them by correlation strength over 60–100 days, and tells you which side (long or short) should earn a positive swap.
Complementary modules—Pro Level, Moving Averages, Volume Profile, and S2T2—round out the picture by answering the “when” and “where” after the Matrix tells you the “what.”
2. Why Swaps Deserve Your Attention
Swaps (sometimes called overnight interest, rollover, or financing) are the small credits or debits you see when a position stays open past the broker’s cutoff time. They come from the difference between the interest rates of the two currencies in a pair.
Reasons swaps matter:
- They add up. A modest +0.5 pip daily credit equals roughly +10 pips on a 20-day holding period.
- They can soften drawdowns. Positive swap on the hedge leg cushions price noise while you wait for mean reversion.
- They signal policy trends. Central banks with rising rates usually support their currencies, giving your long side a double benefit.
For a refresher on how swaps work, Investopedia offers a clear primer: https://www.investopedia.com/terms/s/swap.asp.
3. Inside the Correlation Matrix Pro
The Correlation Matrix Pro window is split into two color-coded groups:
- Left side – Positive correlations (+0.10 to +1.00).
- Right side – Negative correlations (-0.10 to ‑1.00).
Key columns:
| Column | Meaning | Quick tip |
|---|---|---|
| Asset Pair | Symbol combination (e.g., EURUSD, AUDJPY) | Click to load the chart. |
| Correlation | Numeric value & color bar | Deep green or deep red = strong correlation. |
| Swap Long | Daily swap earned if you buy the pair | Look for green (positive). |
| Swap Short | Daily swap earned if you sell the pair | Look for green (positive). |
Color scale:
- Bright Green = +0.80 to +1.00 or positive swap above average.
- Light Green = +0.40 to +0.79.
- Yellow = +0.10 to +0.39 (weak).
- Light Red = ‑0.10 to ‑0.39.
- Bright Red = ‑0.40 to ‑1.00 or negative swap.
Pro Tip: A pair in bright green on both the Correlation column and the Swap column is a prime candidate for a long/short combo.
4. How To Read the Correlation, Swap Long, and Swap Short Columns
- Sort by Correlation. Click the column header once for descending order.
- Check the Time Frame. Toggle between 60-day and 100-day views in the settings.
- Pick a Pair From Each Side. For a hedged book, choose one high positive pair and one high negative pair.
- Scan Swap Columns. Aim for a net-positive swap when the two positions are combined.
- Open the Chart. Double-click the row to load the pair on your platform.
Example snapshot:
| Pair | Correlation | Swap L | Swap S | Action |
|---|---|---|---|---|
| EURUSD | +0.93 | +0.12 | ‑0.25 | Buy (if you want the swap) |
| USDCHF | ‑0.89 | ‑0.45 | +0.38 | Sell (to earn the swap) |
A trader could buy EURUSD and sell USDCHF, aiming for positive carry on both sides while neutralizing directional USD risk.
5. Building a Two-Pair Hedge: Step-by-Step Example
Let’s walk through a real-world template.
Step 1: Define Objectives
- Hold up to two weeks.
- Target +0.20 % account growth from swaps alone.
Step 2: Open the Correlation Matrix Pro
- Set period to 100 days for stability.
- Sort by absolute correlation.
Step 3: Select Pairs
Positive side:   AUDCAD  | Correlation +0.92 | Swap Long +0.25
Negative side:   USDMXN  | Correlation -0.88 | Swap Short +0.70
Step 4: Size the Positions
- Notional value:
- AUDCAD buy 1 lot, margin ~1,000 USD
- USDMXN sell 1 lot, margin ~900 USD
- Combined margin fits the account plan.
Step 5: Check Net Swap
- AUDCAD long +2.5 USD/day
- USDMXN short +7.0 USD/day
- Net = +9.5 USD/day
Step 6: Load Charts & Apply Pro Level
- Confirm both pairs are near a support (buy side) or resistance (sell side) on the Pro Level lines.
Step 7: Place Orders
- Attach stop-loss just beyond the Pro Level zone.
- Set take-profit at the opposing zone or hold until correlation weakens.
6. Swap Hunter Pro Level: Planning Entries and Exits
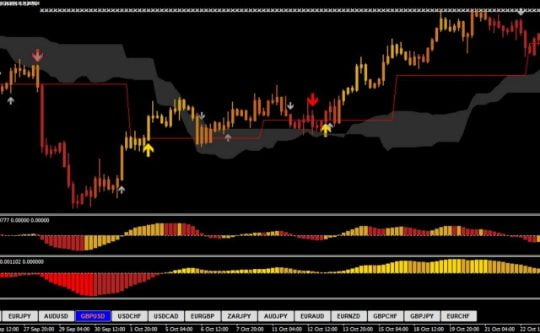
The Pro Level overlay draws horizontal bands matching historical support and resistance. Default settings mark the 20 %, 50 %, and 80 % price percentile of the chosen look-back range. You can:
- Shorten or extend the look-back (e.g., 30, 60, 120 days).
- Adjust levels by percentage points (e.g., 25 %, 75 %).
- Change color and thickness to match your chart style.
Quick checklist:
| Scenario | What to Do |
|---|---|
| Price stalled at upper zone + bearish candle | Consider opening a short (for a negative-correlated pair). |
| Price touches lower zone + bullish pin bar | Consider a long on the positive-correlated pair. |
| Price breaks through and closes above Level 3 | Recalculate stops or exit; structure has changed. |
7. Adding Context With Swap Hunter Moving Averages
The moving average bundle includes EMA-20, EMA-50, EMA-100, and EMA-200. Simple, but effective:
- Trend Filter:
- All EMAs angled up = uptrend → Favor long positions.
- Mixed or flat = range → Tighten stops and shorten holding period.
- Entry Direction:
- Against a strong trend? Consider smaller size.
- With the trend? You can widen the take-profit.
Settings you can tweak:
- Periods (e.g., 34, 89 if you follow Fibonacci numbers).
- MA type (SMA, WMA).
- Color for quick visual discrimination.
8. Locating Supply and Demand Zones With the Volume Profile
The Volume Profile plots horizontal bars that reveal where market participants did most of their business.
Reading the histogram:
- High Peaks = Price Acceptance Zones. Often act as magnets; expect reaction or congestion.
- Low Valleys = Price Vacuums. Price often travels faster through these areas.
Using the Volume Profile together with the Pro Level:
- Find overlapping high-volume peaks with Pro Level support → Strong buy zone.
- Find overlapping low-volume trough with Pro Level resistance → Possible breakout or rapid rejection.
Adjustable settings:
- Number of candles scanned (e.g., last 150 candles on H4 chart).
- Style (solid, gradient).
9. S2T2: Keeping an Eye on Spread and Candle Time
The S2T2 panel is simple but handy:
- Symbol – Confirms you are on the right chart.
- Spread – Important before news; a spread spike can erase a day of swaps.
- Time to Next Candle – Helps plan manual entries on the close or open of a bar.
Tip: Watch for spreads below the 5-day average before opening positions, especially on exotic pairs.
10. Putting It All Together: A Simple Daily Workflow
- Morning Check (before London open)
- Launch Swap Hunter Indicator.
- Sort Correlation Matrix Pro for fresh candidates.
- Mark pairs with net-positive combined swap.
- Chart Review
- Apply Pro Level, Moving Averages, and Volume Profile.
- Check S2T2 for acceptable spreads.
- Trade Setup
- Decide whether to hedge or trade a single pair.
- Position size at 0.5–1 % risk per leg.
- Order Placement
- Set alerts at Pro Level zones.
- Use stop orders if you can’t watch the screen.
- Mid-Day Scan
- Re-check correlation. If it drops below 0.60 (or ‑0.60) consider partial close.
- End-of-Day Maintenance
- Log swap earned.
- Move stop-loss to break-even if the chart confirms.
11. Common Pitfalls and How To Avoid Them
| Pitfall | Prevention |
|---|---|
| Ignoring correlation decay | Revisit the Matrix daily; correlations shift after central-bank speeches or data releases. |
| Blindly chasing high swaps | Confirm technical setup; high-yielding pairs can trend hard against you. |
| Over-leveraging both legs | Treat each leg as a full trade for risk purposes; use smaller lot sizes. |
| Forgetting the triple-swap Wednesday | Some brokers charge or credit three days of swap—check your calendar. |
Need a refresher on risk per trade? Read our position-sizing guide for clear formulas and examples.
12. Frequently Asked Questions
Q: Can I use the Swap Hunter Indicator on crypto pairs?A: Yes, if your broker or exchange provides funding or borrowing rates. Correlation readings work the same way.
Q: How often should I update the moving averages?A: Most traders keep the default EMA-20/50/100/200. Adjust only if your strategy is very short term or you trade exotic time frames.
Q: Do I need to watch the chart all day?A: No. With Pro Level alert lines and stop orders, you can automate most of the management. A quick morning and evening check is usually enough.
Q: What if both legs have negative swaps?A: You can still hedge, but the trade now relies on price movement. Many users simply skip such setups.
13. Final Thoughts
The Swap Hunter Indicator takes what many traders do manually—checking correlations, swaps, and chart levels—and turns it into a single, structured workflow. Use the Correlation Matrix Pro to find pairs that offset risk and pay you for holding. Confirm timing with Pro Level, Moving Averages, Volume Profile, and S2T2.
Ready to dig deeper?
- Bookmark this guide for quick reference.
- Share your favorite swap pair in the comments.
- Subscribe to our newsletter so you never miss an update on the latest Swap Hunter Indicator tips.
Happy trading and may your swaps always be green!
Vendor Site – Click Here
✅ Reviews
✍️ https://youtube.com/@swaphunter4476
| Membership | Yearly Membership |
|---|---|
| Additional Services | Unlock & Decompile |
| Recommended Brokers | Exness Broker, FPMarkets |
| Recommended VPS | FXVM (Low Latency) |
| Youtube Channel | ForexForYou |
| Telegram Channel | Onshoppie Forex EA's & Indicators |
| Telegram Support | Onshoppie Support |
| Installation Guides | Onshoppie Forex Guides |
Brand
Indicator-mt4
Only logged in customers who have purchased this product may leave a review.







Reviews
There are no reviews yet.