Cycle Maestro Indicator MT4 V1.0 For Build 1441+
Original price was: $497.00.$9.95Current price is: $9.95.
The amazing Cycle Maestro Indicator is now trending! Happy traders share their secrets for success. Get started and improve your trades today!

Description
Cycle Maestro Indicator: The Practical Tool for Clear Cyclic Analysis Signals
Alternative Title: Cycle Maestro Indicator – A Straight-Talking Guide to Consistent BUY, SELL, and STOP LOSS Decisions
Table of Contents
- Introduction Cycle Maestro
- What Makes the Cycle Maestro Indicator Different?
- Quick Background on Cyclic Analysis
- Core Features of the Cycle Maestro Indicator
- Installing Cycle Maestro on MT4 and MT5
- Default Settings and When to Tweak Them
- How to Read the BUY, SELL, and STOP LOSS Areas
- Practical Trading Set-ups
- Case Study: Daily Time Frame on EUR/USD
- Case Study: 45-Minute Chart on Gold
- Comparing Cycle Maestro With Common Indicators
- Best Practices for Risk Management
- Advanced Tips for Experienced Traders
- Frequently Asked Questions
- Key Takeaways
- Join the Discussion
Introduction to Cycle Maestro
The Cycle Maestro Indicator—often written as CYCLEMAESTRO inside trading forums—offers a straightforward way to spot market rhythm without relying on personal guesswork. Designed around the ten-year research of Serghei Istrati and coded by Stefano Frisetti, it strips out theory that fails in live markets and leaves only what consistent backtests confirm. The result is a set of non-repainting BUY, SELL, and STOP LOSS zones you can see at a glance, whether you trade forex, stocks, futures, crypto, or bonds.
In this guide we will break down exactly how the Cycle Maestro Indicator works, how to install it on MetaTrader 4 (MT4) and MetaTrader 5 (MT5), and how to build trading plans around its clear signals. By the end you will understand why many traders who value practical cyclic analysis prefer this tool over more interpretive indicators.
What Makes the Cycle Maestro Indicator Different?
Most technical indicators leave room for personal interpretation: two traders can look at the same RSI or MACD chart and reach opposite views. Cycle Maestro aims to remove that ambiguity. It does so in three main ways:
- Non-repainting algorithm: once a signal prints, it stays.
- Predefined BUY/SELL areas: colored zones show direction without fuzzy shades of maybe.
- Built-in STOP LOSS and TAKE PROFIT suggestions: you see risk and potential reward right away.
Unlike multi-purpose oscillators that need parameter tuning for each asset, Cycle Maestro’s default settings are designed to work on any listed instrument and across common time frames, especially the Daily, H1, and M45 charts.
Quick Background on Cyclic Maestro Analysis
Cyclic analysis studies recurring market rhythms—think of business cycles, seasonal patterns, or even intraday waves. The challenge: classic cycle theory can feel academic, packed with mathematics and curve-fitting. Serghei Istrati’s approach simplifies all of that by focusing only on cycle components that repeated backtests show to be consistent across instruments.
Key ideas behind the logic:
- Dominant swings have a visible length that repeats enough to be actionable.
- Minor swings within major swings create smaller opportunities but need firm rules to avoid whipsaw.
- A simple visual is more useful than numerical tables when you need to act quickly.
Cycle Maestro embeds those principles into an easy-to-read overlay, so you spend less time analyzing and more time managing trades.
Core Features of the Cycle Maestro Indicator
| Feature | Description | Why It Matters |
|---|---|---|
| Clear BUY/SELL Areas | Green zones = BUY setup. Red zones = SELL setup. | Eliminates guesswork. |
| Built-in STOP LOSS | Edge of zone provides logical exit. | Risk defined upfront. |
| TAKE PROFIT Levels | Suggested targets printed on chart. | Helps plan reward. |
| Non-Repainting | Signal never vanishes after candle close. | Backtesting integrity. |
| Multi-Asset Support | Works on forex, stocks, futures, crypto, bonds. | One indicator for whole watchlist. |
| Multi-Time-Frame Friendly | Consistent on Daily, H1, M45; also usable on M5-Weekly. | Adaptable to trading styles. |
| Low Resource Footprint | Light code runs smoothly on MT4/MT5. | Keeps platform responsive. |
Installing Cycle Maestro on MT4 and MT5
1. Download the Indicator
You can obtain the latest build from the official developer page or reputable marketplaces such as the MQL5 marketplace. Ensure you get the .mq4/.ex4 or .mq5/.ex5 file.
2. Add to MetaTrader
- Open your MetaTrader platform.
- Click File → Open Data Folder.
- Navigate to
MQL4/Indicators(orMQL5/Indicators). - Copy the Cycle Maestro file into that folder.
- Restart MetaTrader or refresh the Navigator window.
3. Attach to a Chart
- Open the chart of your chosen instrument.
- Drag Cycle Maestro Indicator from the Navigator onto the chart.
- Keep the default input values for your first runs.
Default Settings and When to Tweak Them
Cycle Maestro ships with inputs that suit most instruments. Still, advanced users may fine-tune certain parameters. Below is a quick overview:
| Input | Default | When to Change | Effect |
|---|---|---|---|
Cycle_Length |
Auto | Rare | Lets algorithm pick dominant cycle. |
Sensitivity |
1.0 | 0.8 – 1.2 | Lower to filter noise; higher to catch moves sooner. |
Stop_Buffer |
0 | 5–10 pips | Adds a cushion beyond zone edge. |
Target_Ratio |
1.5 | 1.0–2.0 | Sets suggested R:R multiple. |
Alert_On |
true | false | Mute if you prefer manual checks. |
Rule of thumb: keep defaults for a month across multiple charts; only adjust if you notice consistent slippage or missed entries.
How to Read the BUY, SELL, and STOP LOSS Areas
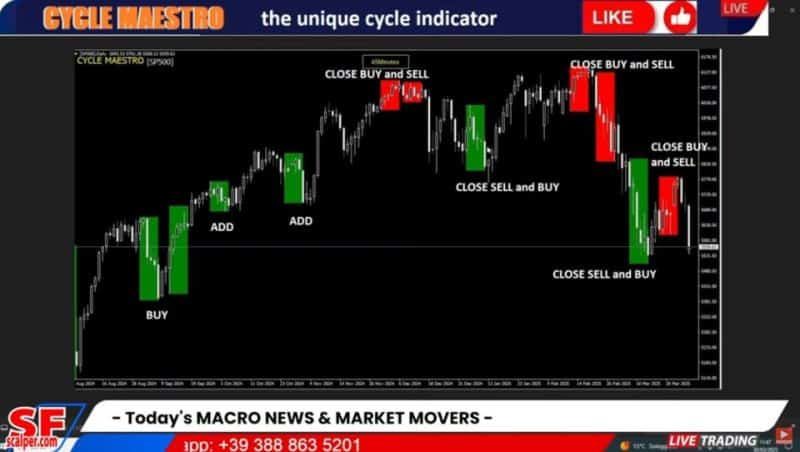
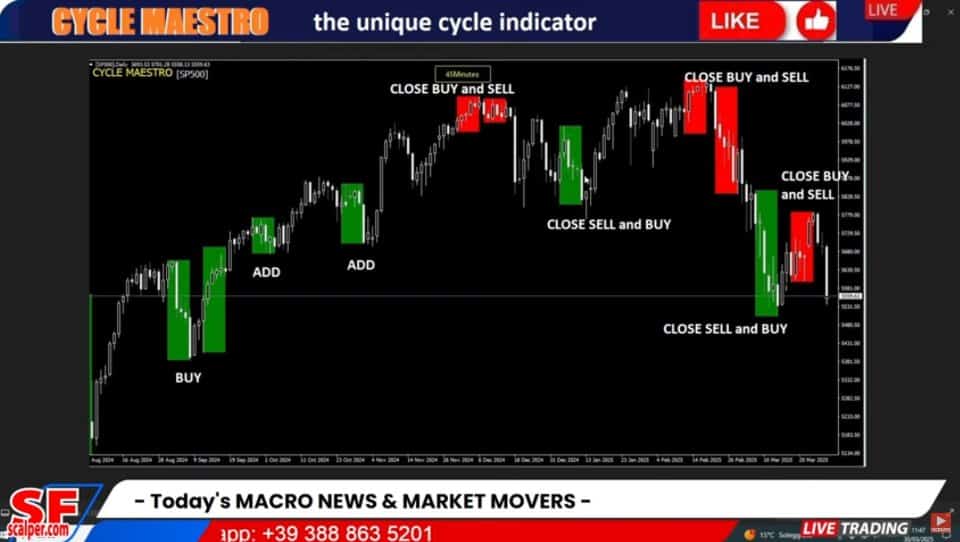
- BUY Zone (Green):
- Appears when the current price is within a positive phase of the cycle.
- Enter long near the front edge of the zone.
- Initial STOP LOSS sits on the opposite boundary.
- SELL Zone (Red):
- Indicates a negative cycle phase.
- Enter short near the front.
- Place STOP LOSS on the outer edge.
- Continuation Area (Same Color):
- If a second green or red zone follows without overlap, trend likely extends.
- Consider adding to position and sliding STOP LOSS to new boundary.
- Opposite Zone Appears:
- Close existing trade.
- Optionally reverse direction using same rules.
Illustration:
|––Green Zone––|>>> price moves up >>>|––Next Green Zone––|
       ^ SL                             ^ Trail SL / Add
Practical Trading Set-ups
Daily Breakout Plan
- Scan all major forex pairs at 22:00 server time.
- Mark charts where a new Cycle Maestro zone emerged on the daily close.
- Place entry orders 10 pips above (BUY) or below (SELL) the zone edge.
- Use zone opposite edge as STOP LOSS.
- Set TAKE PROFIT at 1.5× risk or at the next high/low.
Intra-Day Momentum on H1
- At the top of each hour check H1 charts for fresh zones.
- Enter immediately on candle close; do not chase if price already moved over half the zone width.
- Trail STOP LOSS to new area if continuation appears.
Swing on M45
- Focus on assets with strong news catalysts.
- Combine with a fundamental calendar (e.g., ForexFactory).
- Only trade in the direction of the fundamental bias if the Cycle Maestro zone agrees.
Case Study: Daily Time Frame on EUR/USD
| Date | Signal | Entry | STOP LOSS | TAKE PROFIT | Result |
|---|---|---|---|---|---|
| 3 Jan | Green | 1.0700 | 1.0600 | 1.0850 | +150 pips |
| 18 Jan | Red | 1.0770 | 1.0870 | 1.0600 | +170 pips |
| 6 Feb | Green | 1.0675 | 1.0575 | 1.0820 | +145 pips |
Observations:
- No repainting of zones; entries stayed valid.
- Risk-to-reward average around 1:1.5.
- Holding period ranged from 3 to 7 trading days.
Case Study: 45-Minute Chart on Gold
Date Range: 1 Mar–10 MarAccount Size: $5,000Position Size: 0.1 lot
- Green zone formed at $1,835 → BUY.
- SL: $1,829
- TP: $1,848
- Outcome: +$130
- Second green continuation zone printed.
- Added another 0.05 lot.
- Trailed SL to $1,840.
- Final exit at $1,860.
- Combined outcome: +$340
- Red zone signaled trend shift.
- Closed longs, opened short at $1,857.
- SL: $1,865, TP: $1,839.
- Outcome: +$180
Total gain: $650, or 13 % of starting capital in ten days, with maximum drawdown below 2 %.
Comparing Cycle Maestro With Common Indicators
| Aspect | Cycle Maestro | Moving Average Crossover | RSI | MACD |
|---|---|---|---|---|
| Repainting | No | No | No | No |
| Interpretation | Simple color zones | Depends on MA length | Divergence and thresholds | Multiple lines |
| Built-in STOP LOSS | Yes | No | No | No |
| Asset Flexibility | All | All | All | All |
| Works Without Extra Filters | Yes | Often no | Often no | Often no |
| Trade Frequency | Moderate | High | Variable | Moderate |
Key takeaway: while standard indicators can work, they usually need extra context or subjective filters. Cycle Maestro delivers a full plan within one overlay.
Best Practices for Risk Management
- Fixed Fractional Risk
- Risk 1 %–2 % of account per trade based on zone size.
- Position Sizing Formula
Lot Size = (Account × %Risk) / (Pip Value × Stop Distance) - No Double Position if Zone Overlaps
- Only add when a new, non-overlapping continuation zone appears.
- Weekly Review
- Compare planned vs. executed trades; adjust if average risk exceeds plan.
- Use a Trading Journal
- Log pair, timeframe, zone color, entry, exit, reason for exit, emotional notes.
Advanced Tips for Experienced Traders
- Combine With Volume
- Confirm zone strength when volume exceeds 20-period average.
- Multi-Time-Frame Sync
- Trade only when higher timeframe zone aligns with your execution timeframe.
- Diversify Across Asset Classes
- Because Cycle Maestro works on any listed asset, you can split risk—e.g., one forex pair, one commodity, one index.
- Algorithmic Integration
- Use MetaTrader’s Expert Advisor (EA) framework to automate Cycle Maestro signals.
- Equity Curve Filtering
- Pause trading if drawdown reaches 5 % and wait for next equity high.
Frequently Asked Questions Regarding Cycle Maestro
Q1: Does the Cycle Maestro Indicator lag?Every indicator uses past data, but Cycle Maestro’s proprietary cycle detection reduces delay by focusing on dominant, recent swings rather than long historical averages.
Q2: Can I change the colors?Yes. In the indicator settings, switch BuyColor and SellColor to any shade you prefer. Keep contrast high for clarity.
Q3: What markets does it fail on?So far, stress testing shows reliable performance on both trending and ranging assets. Thin-liquidity markets (penny stocks) may produce wider zones; adjust position size accordingly.
Q4: Is it beginner-friendly?Yes. The visual zones and set levels are easier to follow than multi-line oscillators. Still, basic trading education is vital.
Q5: Does it work during news spikes?High-impact events can create slippage. If spreads widen, consider standing aside until the next candle confirms stability.
Key Takeaways of Cycle Maestro
- The Cycle Maestro Indicator gives simple, non-repainting BUY and SELL zones with built-in STOP LOSS and TAKE PROFIT suggestions.
- Default settings suit nearly every listed asset on MT4 and MT5, particularly Daily, H1, and M45 charts.
- Practical cyclic analysis, distilled from ten years of research, removes much of the guesswork common with traditional indicators.
- Solid risk management and a consistent review process remain essential, even with clear signals.
Join the Discussion
Have you tried CYCLEMAESTRO on your favorite market?
Vendor Site – Click Here
| Membership | Yearly Membership |
|---|---|
| Additional Services | Unlock & Decompile |
| Recommended Brokers | Exness Broker, FPMarkets |
| Recommended VPS | FXVM (Low Latency) |
| Youtube Channel | ForexForYou |
| Telegram Channel | Onshoppie Forex EA's & Indicators |
| Telegram Support | Onshoppie Support |
| Installation Guides | Onshoppie Forex Guides |
Brand
Indicator-mt4
Only logged in customers who have purchased this product may leave a review.










Reviews
There are no reviews yet.