


Break and Retest Indicator MT4 V5.0+Setfiles For Build 1471+
Original price was: $50.00.$14.95Current price is: $14.95.
Discover the ultimate Break and Retest Indicator that delivers mind-blowing trading results. Transform your strategy with this powerful tool today!





Description
Break and Retest Indicator: The No-Nonsense Way to Spot High-Probability Trades
Break and Retest Indicator – How This Price Action Tool Helps You Wait, Watch, and Win
Table of Contents
- What Is the Break and Retest Indicator?
- Why “Break and Retest” Beats Chasing Price
- Best Charts, Pairs, and Timeframes
- Common Questions and Quick Answers
- Next Steps – Try the Indicator on Your Own Chart
What Is the Break and Retest Indicator?
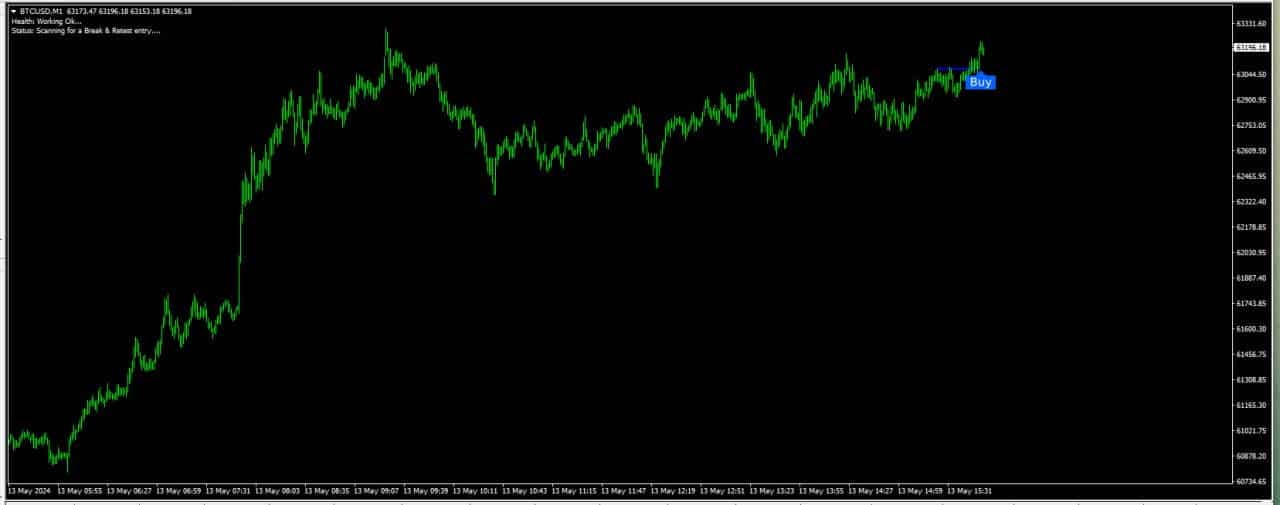
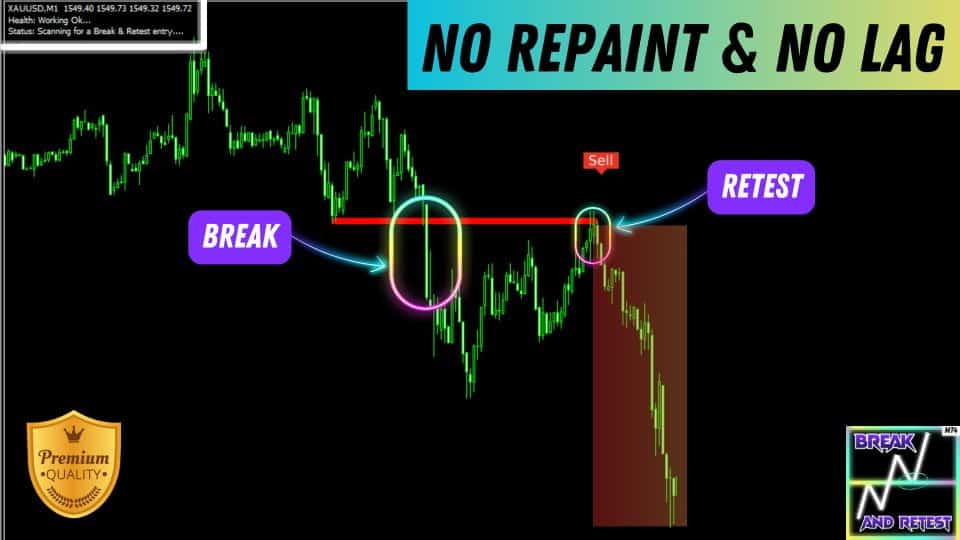
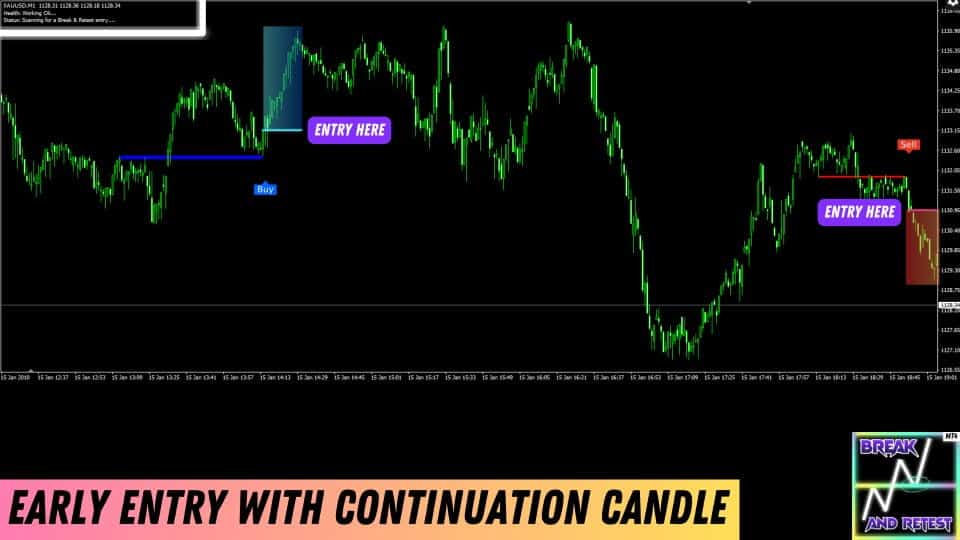
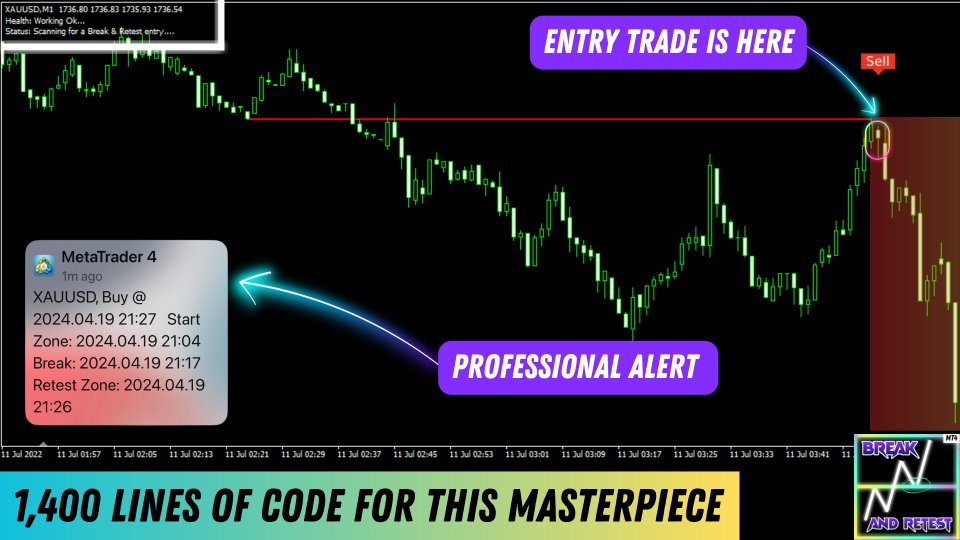
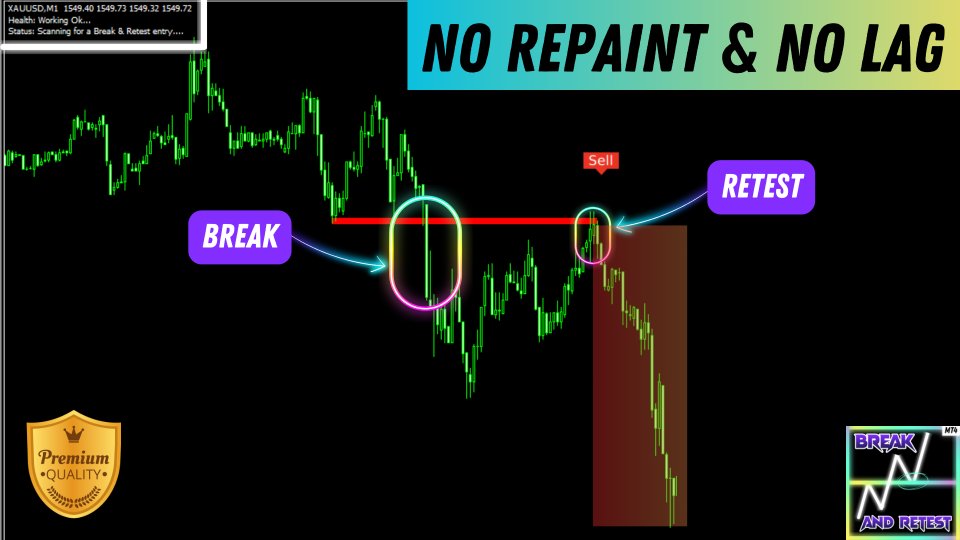
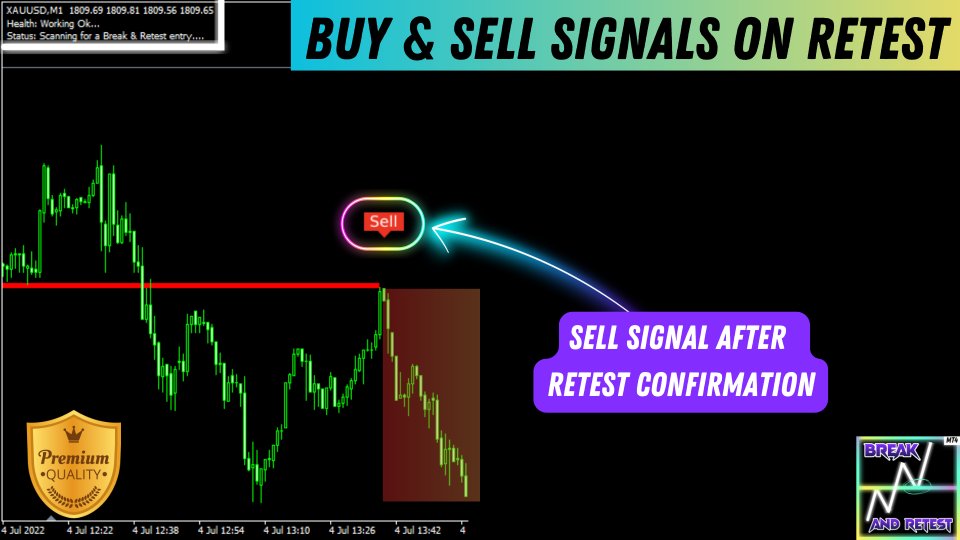
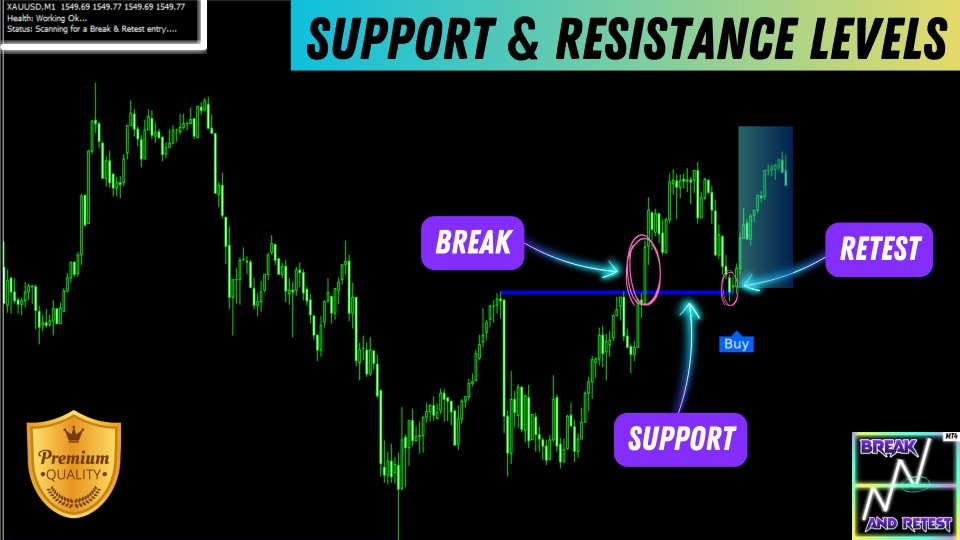
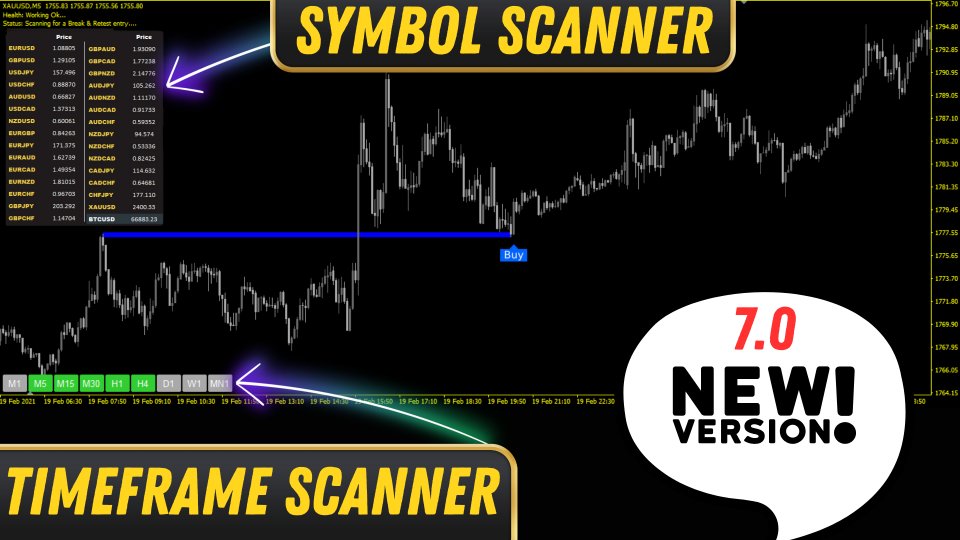
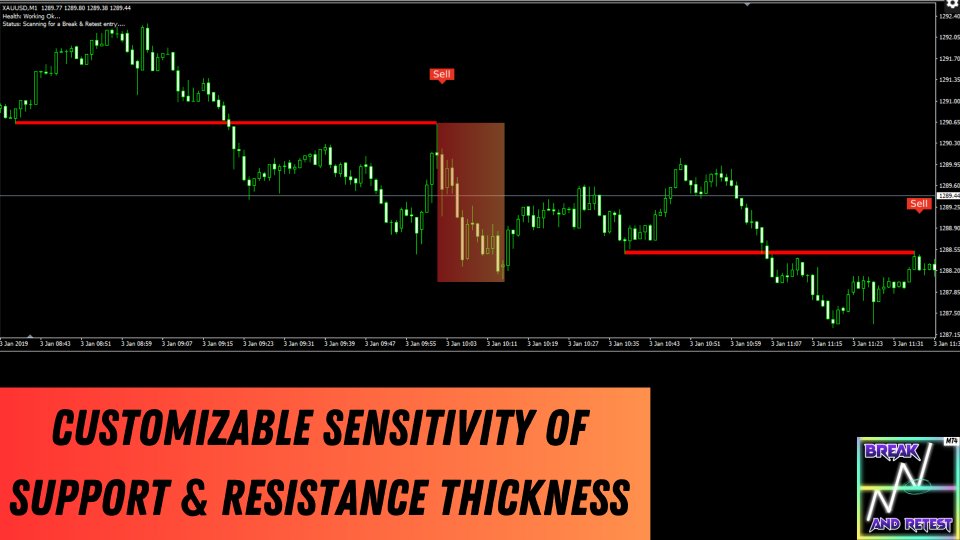
The Break and Retest Indicator is a script for MetaTrader 4 (MT4) that watches price levels for you. It waits until price breaks a clear support or resistance zone, pulls back to that same zone, rejects it with visible wicks, and only then prints a buy or sell arrow.
In plain English:
- Price jumps over a fence (break).
- Price walks back to tap the fence (retest).
- Other traders defend the fence (wick rejection).
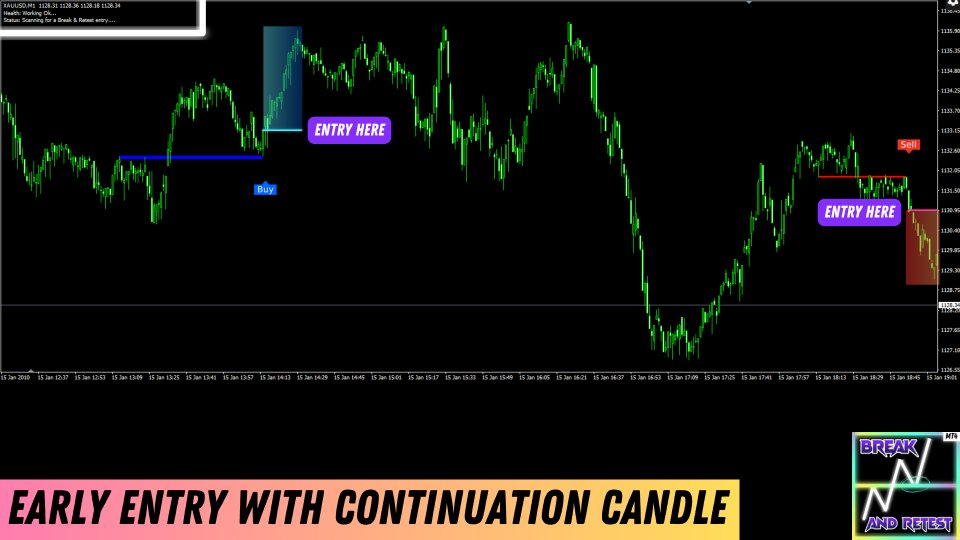
- The candle keeps moving in the break direction (continuation).
- You get a clean signal with all that work done in the background.
Because the tool checks every box before it alerts, this indicator only places quality trades when the market is really in your favor with a clear break and retest.
Why “Break and Retest” Beats Chasing Price
Patience Pays
Many traders jump in on the first breakout candle, only to watch price snap back. The Break and Retest approach forces you to wait for:
- A level to be broken.
- A level to be retested.
- Sellers or buyers to defend that level.
Patience is key with this price action strategy! By waiting, you cut down on false moves and skip the noise.
Statistics Back It Up
Back-testing across Forex, metals, indices, and crypto shows that entries taken after a confirmed retest deliver:
- Higher average reward-to-risk ratios
- Fewer whipsaw losses
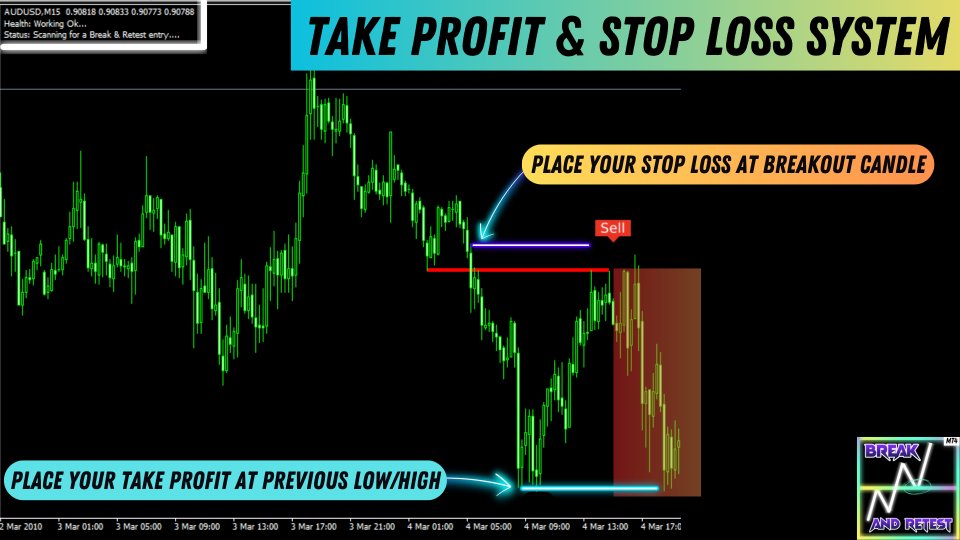
- Clearer stop-loss placement (just above or below the retest wick)
Best Charts, Pairs, and Timeframes for Break and Retest
• Forex Majors (EURUSD, GBPUSD, USDJPY) – Tight spreads; retests are clean.• Gold (XAUUSD) – High volatility gives frequent retests on M15-H1.• Indices (US30, NAS100) – Use H1-H4 to cut out false breaks.• Crypto (BTCUSD) – Works on the 4-hour chart where levels have weight.
Timeframe advice:
| Trader Type | Timeframe | Why |
|---|---|---|
| Day trader | M15 – M30 | Plenty of setups; exit the same day |
| Swing trader | H1 – H4 | Balance between noise and clarity |
| Position trader | D1 | Big zones, strong moves, low stress |
Common Questions and Quick Answers
Q: Does the indicator repaint?A: No. Once a candle closes, the arrow and zone stay fixed.
Q: Can it be used on MT5 or TradingView?A: The current version is MT4 only. A TradingView port is planned; join the newsletter for updates.
Q: Where do I put my stop-loss?A: A few points above/below the longest wick in the retest cluster.
Q: What if I miss the entry candle?A: Wait for a new break and retest; do not chase late price moves.
Next Steps – Try the Indicator on Your Own Chart
Ready to put the Break and Retest Indicator to work? Download the file, drag it on a demo chart, and watch for:
Health: Working Ok...
Status: Scanning for a Break & Retest entry...
When your first blue or orange arrow pops up, mark the setup in your trading journal. After ten demo trades you will have solid data to decide whether to go live.
Quick CTA
External resources for extra reading:• Investopedia – Support & Resistance Basics•
Happy trading, and remember: patience first, trade second.
Manual guide: Click here
Vendor Site – Click Here
| Membership | Yearly Membership |
|---|---|
| Additional Services | Unlock & Decompile |
| Recommended Brokers | Exness Broker, FPMarkets |
| Recommended VPS | FXVM (Low Latency) |
| Youtube Channel | ForexForYou |
| Telegram Channel | Onshoppie Forex EA's & Indicators |
| Telegram Support | Onshoppie Support |
| Installation Guides | Onshoppie Forex Guides |
Brand
Indicator-mt4
Only logged in customers who have purchased this product may leave a review.
Related products


Products
-
 Gold House EA MT5 v2.0 For Build 5833+
Original price was: $749.00.$14.95Current price is: $14.95.
Gold House EA MT5 v2.0 For Build 5833+
Original price was: $749.00.$14.95Current price is: $14.95.
-
 Gold Safe EA MT4 v1.1 For Build 1471+
Original price was: $399.00.$14.95Current price is: $14.95.
Gold Safe EA MT4 v1.1 For Build 1471+
Original price was: $399.00.$14.95Current price is: $14.95.
-
 CAPITAL X EA MT5 v1.8 + SetFiles With DLL 5833
$34.95
CAPITAL X EA MT5 v1.8 + SetFiles With DLL 5833
$34.95
-
 BB Return EA MT5 v7.40 For Build 5833+
Original price was: $549.00.$14.95Current price is: $14.95.
BB Return EA MT5 v7.40 For Build 5833+
Original price was: $549.00.$14.95Current price is: $14.95.
-
BB Return EA MT4 v7.40 For Build 1471+
Original price was: $549.00.$14.95Current price is: $14.95.
-
 Gold Strike AI EA MT5 v1.2 For Build 5833+
Original price was: $1,795.00.$14.95Current price is: $14.95.
Gold Strike AI EA MT5 v1.2 For Build 5833+
Original price was: $1,795.00.$14.95Current price is: $14.95.
-
 Chiroptera EA MT5 v3.2 + SetFiles For Build 5833+
Original price was: $899.00.$14.95Current price is: $14.95.
Chiroptera EA MT5 v3.2 + SetFiles For Build 5833+
Original price was: $899.00.$14.95Current price is: $14.95.
-
 TwisterPro Scalper EA MT5 v1.8 + SetFiles For Build 5833+
Original price was: $399.00.$14.95Current price is: $14.95.
TwisterPro Scalper EA MT5 v1.8 + SetFiles For Build 5833+
Original price was: $399.00.$14.95Current price is: $14.95.
Recent reviews
-
 Advanced Dashboard Currency Strength
by Balram
Advanced Dashboard Currency Strength
by Balram
Reviews
There are no reviews yet.