BBMA Oma Ally Analyzer Dashboard EA MT4 V3.60
Original price was: $125.00.$9.95Current price is: $9.95.
Discover amazing secrets of BBMA Oma Ally Analyzer Dashboard EA. Boost your trading with powerful insights and proven strategies.
Description
Table of Contents
- What Is the BBMA Oma Ally Analyzer Dashboard EA?
- How the Dashboard Helps Different Types of Traders
- Core Parts of the BBMA Method Built Into the EA
- Setting Up the BBMA ANALYZER DASHBOARD EA on MetaTrader 4
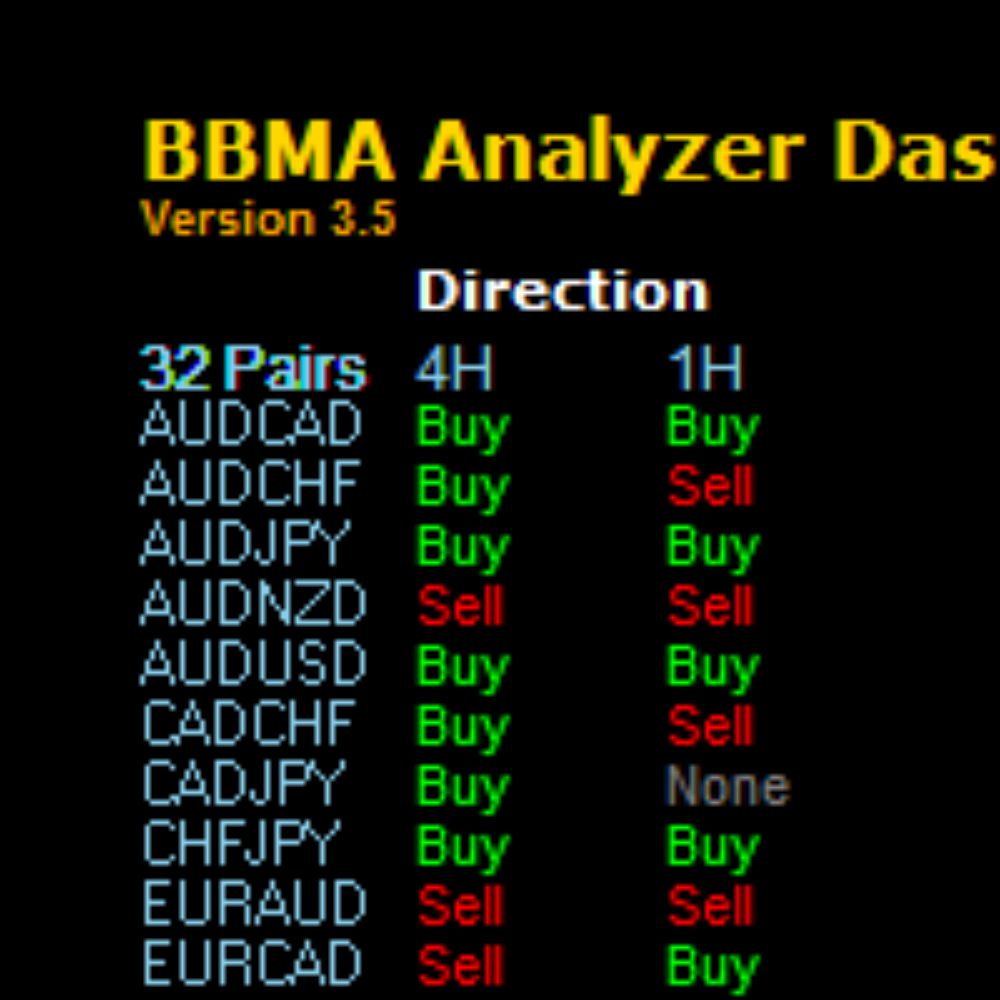
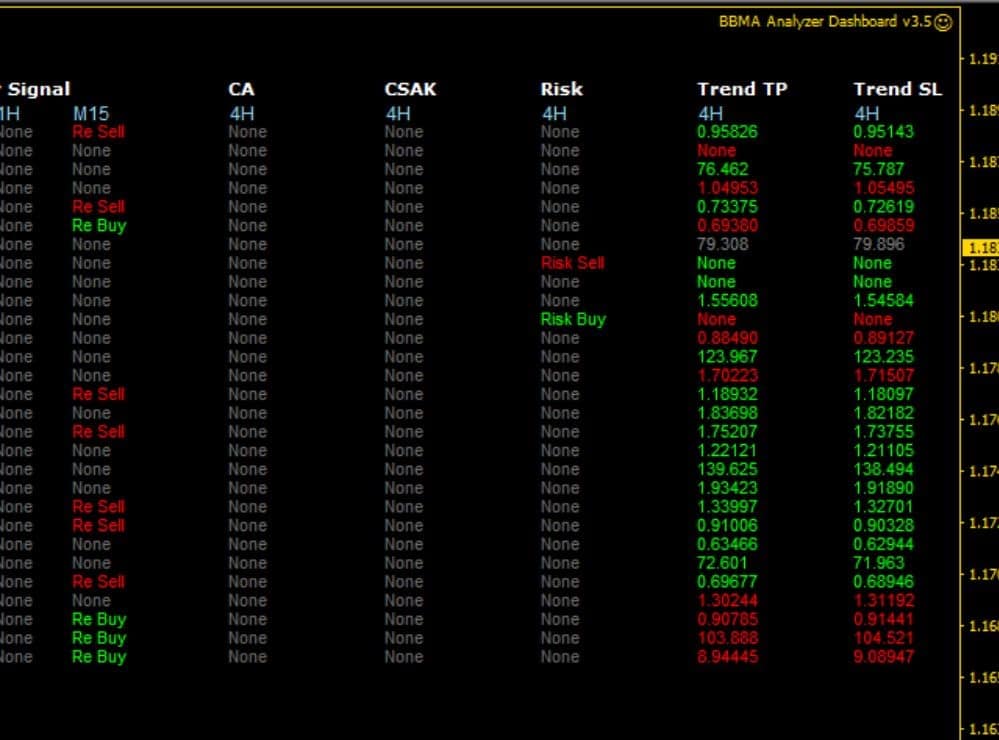
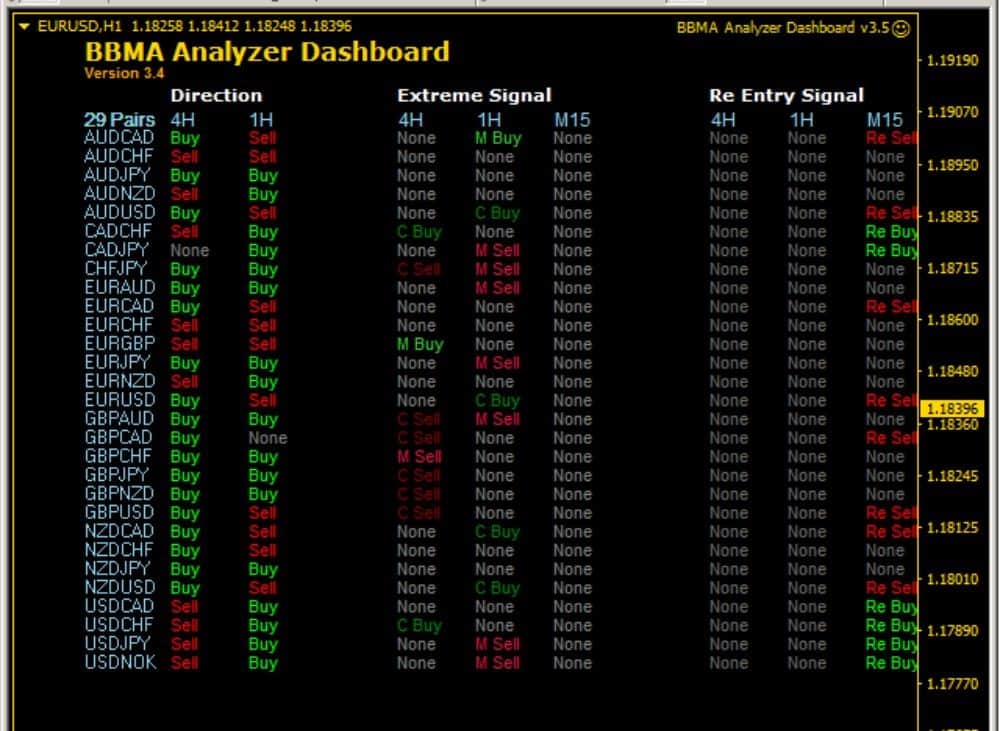
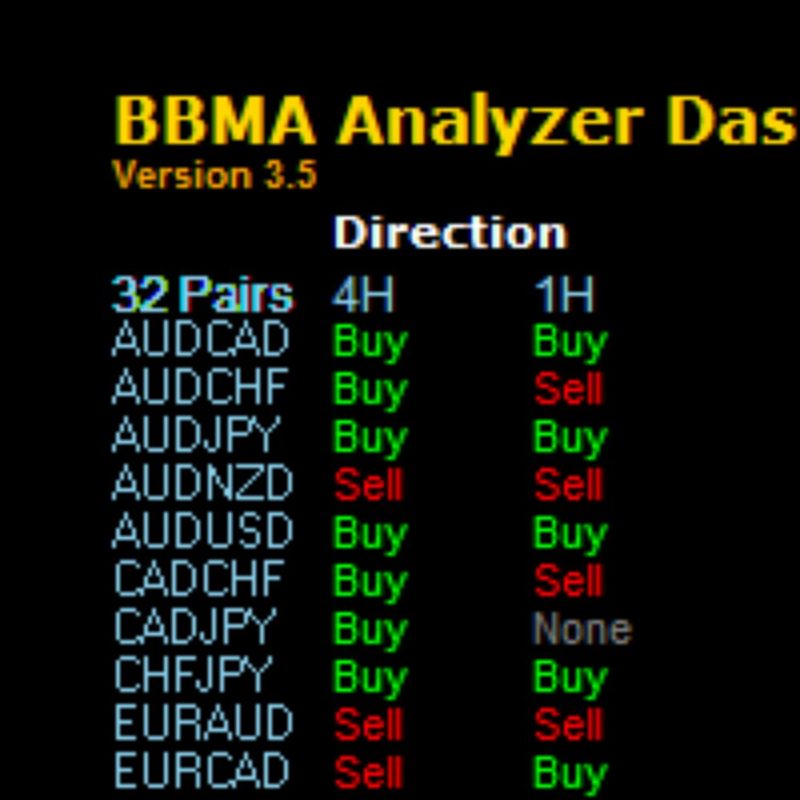
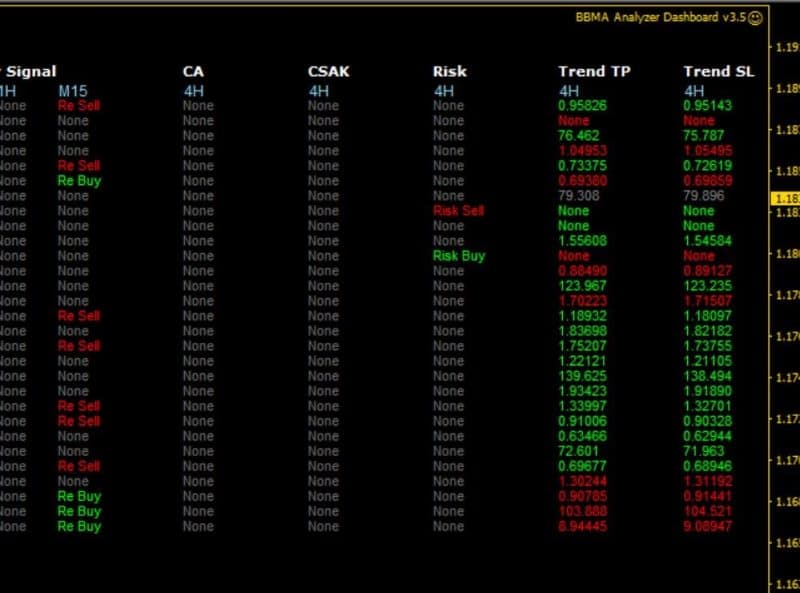
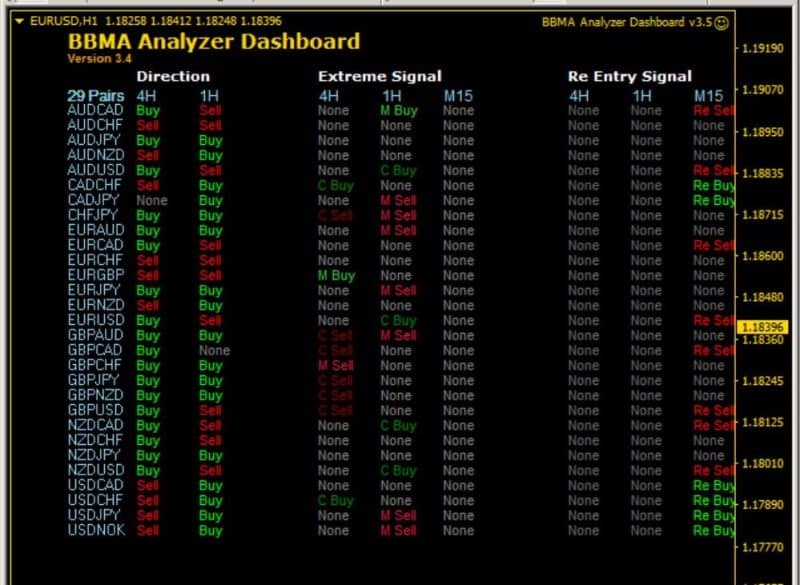
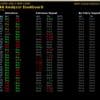
- Reading the Main Screen: Trend, Extreme, and Range Signals
- Risk Management: How the EA Uses ATR-Based Stop Loss and Take Profit
- Practical Trading Plans Using the BBMA Dashboard
- Frequently Asked Questions
- Final Thoughts
What Is the BBMA OMA ANALYZER DASHBOARD EA?
The BBMA Oma Ally Analyzer Dashboard is an expert advisor for MetaTrader 4 that turns the well-known BBMA trading technique (Bollinger Bands + Moving Averages) into clear on-screen signals. In short, it scans any currency pair on the H4 and H1 timeframes and shows:
- The current trend (Up Trend or Downtrend)
- Fresh “Extreme” alerts when price pushes beyond the outer Bollinger Bands
- Ready-made Stop Loss (SL) and Take Profit (TP) levels based on the Average True Range (ATR)
Because the panel does the number-crunching in the background, you do not need deep knowledge of BBMA rules to follow along. The goal is to help you decide when to buy or sell with less guesswork.
How the BBMA Oma Ally Analyzer Dashboard Helps Different Types of Traders
| Trader Type | Common Pain Point | Dashboard Benefit |
|---|---|---|
| Complete beginner | Unsure how to read Bollinger and MA signals | One-click view of trend direction and extremes |
| Part-time trader | Limited screen time | Real-time alerts sent by email, push, or pop-up |
| Experienced discretionary | Manually checks many pairs daily | Multi-pair scan saves time |
| System trader | Needs mechanical rules | Built-in ATR-based SL/TP for consistent risk control |
Why Real-Time Data Matters
Currencies can jump dozens of pips in minutes during major sessions. A static chart snapshot is often too late. The EA refreshes on every new tick, so the trend and extreme labels stay current without manual reloads.
Core Parts of the BBMA Oma Ally Analyzer Dashboard Method Built Into the EA
1. Bollinger Bands (BB)
- Outer Bands: Mark potential reversal zones.
- Middle Band (20-period SMA): Acts as mean reversion target.
2. Moving Averages (MA)
- Fast MA (5): Tracks short-term price action.
- Slow MA (10 or 20): Shows underlying direction.
- Crossovers and price interaction with these lines help confirm entries.
3. ATR for Risk Control
The EA multiplies current ATR values by a user-defined factor to set SL and TP, adjusting to market volatility automatically.
Further reading: “Why ATR Beats Static Pip Targets in Modern FX” on FX-Library (external link).
Setting Up the BBMA OMA ANALYZER DASHBOARD EA on MetaTrader 4
Follow these three quick steps:
- Download and Install
- Place the BBMA Oma Ally Analyzer Dashboard.ex4 file into
/MQL4/Experts/inside your MT4 data folder.
- Place the BBMA Oma Ally Analyzer Dashboard.ex4 file into
- Attach to a Chart
- Open any chart, H4 or H1 preferred, then drag the EA onto it.
- Input Settings
- Symbols list: e.g.,
EURUSD, GBPUSD, USDJPY, XAUUSD - ATR factor for SL: default
1.5 - ATR factor for TP: default
3.0 - Alert methods: choose pop-up, email, phone push.
- Symbols list: e.g.,
Tip: Save a Chart Template so you do not repeat these steps each time.
Reading the Main Screen: Trend, Extreme, and Range Signals
A. Trend Column
- Green Up Arrow — Up Trend on chosen timeframe
- Red Down Arrow — Downtrend
The color coding lets you scan ten or more pairs in seconds.
B. Extreme Column
- “High”: Price closes outside upper Bollinger Band.
- “Low”: Price closes outside lower Bollinger Band.
Extreme signals often mark the start of a pullback. Some traders wait for a candle back inside the bands before entry.
C. Range Column
When neither trend nor extreme is strong, the EA labels the pair as “Range,” reminding you to stay patient or switch strategies.
Risk Management: How the EA Uses ATR-Based Stop Loss and Take Profit
- Calculate Current ATR
- The EA reads the latest ATR value on the chart timeframe.
- Multiply by User Factor
- Example: ATR(14) = 30 pips on H1. Using factor 1.5 => SL = 45 pips.
- Set TP at x2 or x3 of ATR
- With factor 3.0 => TP = 90 pips.
Why ATR Beats Fixed Pip Numbers
- Volatility Adapts: During high news events, ATR widens, giving your trade more room.
- Consistency: Keeps risk-reward ratio stable over months.
Practical Trading Plans Using the BBMA Oma Ally Analyzer Dashboard
Below are three sample approaches you can test on a demo account. All examples assume a 1% risk per trade.
1. Simple Trend-Follow Strategy
- Wait for an Up Trend signal on both H4 and H1.
- Check that price is above the Slow MA.
- Place a market BUY, SL and TP auto-filled by EA.
- Move SL to break-even when price reaches half of TP.
2. Extreme Reversal Strategy
- Spot an “Extreme High” alert on H1.
- Confirm that price is also near the upper band on H4.
- Enter a SELL once a candle closes back inside the bands.
- Use the EA’s ATR-based levels; consider a 1:2 risk-reward.
3. Multi-Pair Basket
- Pick the top three pairs with matching Up Trend on H4.
- Divide total risk (e.g., 3%) across these trades.
- Hold until each reaches its own TP or H4 trend flips.
Frequently Asked Questions Regarding BBMA Oma Ally Analyzer Dashboard
Q1. Do I need to keep my computer on 24/7?Yes, unless you host your MT4 on a VPS. Most traders choose a low-cost VPS to keep the EA running without interruptions.
Q2. Can I change the Bollinger Band period?Sure. The inputs field allows you to adjust period, deviation, and shift.
Q3. Is it only for forex?The EA can read any chart that MT4 supports, including gold (XAUUSD), oil, and some indexes, but back-test before going live.
Q4. How often does it update?The dashboard refreshes every tick, giving near real-time feedback.
Final Thoughts About BBMA Oma Ally Analyzer Dashboard
The BBMA OMA ANALYZER DASHBOARD EA turns a proven set of Bollinger Band and Moving Average rules into an easy-to-read panel on MetaTrader 4. By showing trend, extreme moves, and ATR-based risk levels in one place, it helps both new and experienced traders cut down on chart clutter and focus on clear trade ideas. Before using real money, always test the EA on a demo account, fine-tune the settings, and make sure the risk numbers match your comfort level.
Disclaimer: Trading involves risk. Past performance is not a guarantee of future results.
Vendor Site – Click Here
| Membership | Yearly Membership |
|---|---|
| Additional Services | Unlock & Decompile |
| Recommended Brokers | Exness Broker, FPMarkets |
| Recommended VPS | FXVM (Low Latency) |
| Youtube Channel | ForexForYou |
| Telegram Channel | Onshoppie Forex EA's & Indicators |
| Telegram Support | Onshoppie Support |
| Installation Guides | Onshoppie Forex Guides |
Brand
ea-mt4
Indicator-mt4
Only logged in customers who have purchased this product may leave a review.









Reviews
There are no reviews yet.