Fibonacci Progression With Breaks MT5 + MT4
$9.95
Master the art of Fibonacci progression with Breaks our expert guide. Learn how strategic breaks can amplify your sequence’s effectiveness.

Description
Fibonacci Progression With Breaks: A Powerful Tool for Trend Analysis
Alternative Title: Fibonacci Progression With Breaks: Unveiling Market Reversals and Trends
Table of Contents
- Introduction to Fibonacci Progression With Breaks
- Understanding the Mechanics
- Key Features and Settings
- How to Use Fibonacci Progression With Breaks
- Identifying Trends and Reversals
- The Role of Breaks in Fibonacci Progression
- Support and Resistance Levels
- Practical Applications in Different Markets
- Tips for Optimizing Your Trading Strategy
- Conclusion
Introduction to Fibonacci Progression With Breaks
Fibonacci Progression With Breaks is a sophisticated trading indicator that has gained popularity among traders for its ability to identify potential market reversals and trend changes. This powerful tool combines the principles of Fibonacci sequences with price deviation analysis to provide traders with valuable insights into market dynamics.
The indicator works by highlighting points where the price significantly diverges from a central level, offering traders a clear visual representation of potential turning points in the market. By incorporating Fibonacci sequence values and the Average True Range (ATR), this indicator adapts to market volatility and provides a comprehensive view of price movements.
Understanding the Mechanics Of Fibonacci Progression With Breaks
At its core, Fibonacci Progression With Breaks focuses on two key elements:
- Price Deviation: The indicator measures how far the current price has moved away from a central level. This deviation is calculated using either a user-defined value or a multiple of the 200-period ATR.
- Fibonacci Sequence: The well-known Fibonacci sequence is used to create progressively larger thresholds for identifying significant price movements. As the price continues to deviate from the central level, the indicator uses higher Fibonacci numbers to determine if the movement is significant.
The combination of these elements allows traders to spot potential reversal points and identify ongoing trends with greater accuracy.
Key Features and Settings Of Fibonacci Progression With Breaks
Fibonacci Progression With Breaks offers several customizable features to suit different trading styles and preferences:
- Method Selection: Traders can choose between “Manual” and “ATR” methods for calculating deviation distances. The Manual method allows for direct input of deviation points, while the ATR method uses a multiple of the Average True Range.
- Size Adjustment: Users can set the deviation size either in direct points (for Manual method) or as an ATR multiplier (for ATR method). This flexibility allows traders to fine-tune the indicator’s sensitivity to market movements.
- Sequence Length: Traders can limit the maximum number of significant deviations to analyze. This feature helps in controlling the complexity of the analysis and focusing on the most relevant price movements.
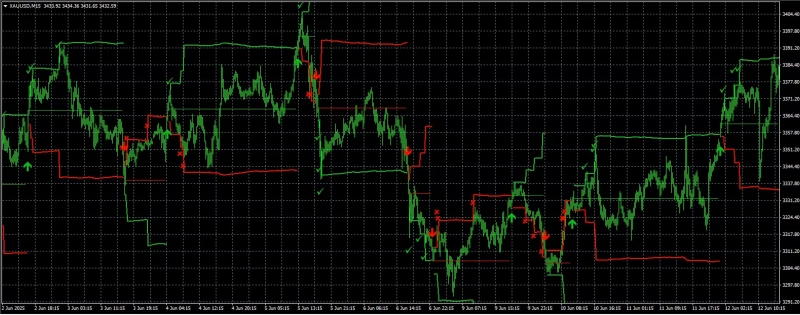
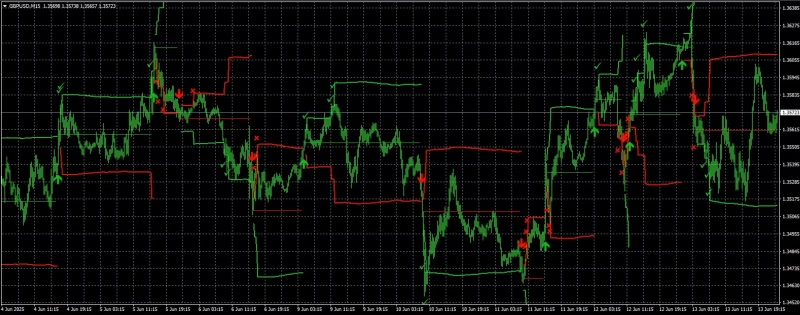
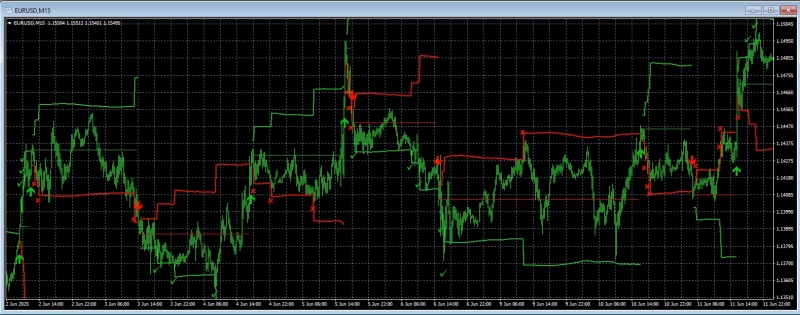
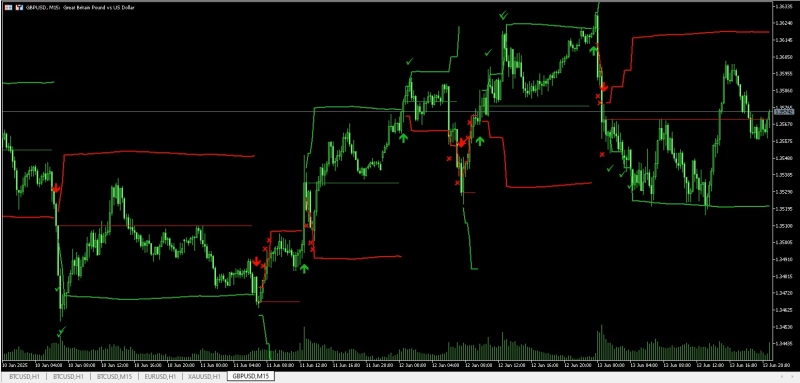
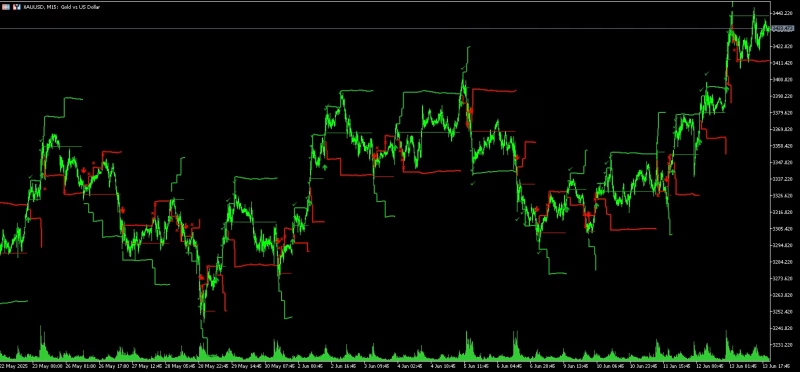
- Visual Cues: The indicator provides clear visual signals, such as checkmarks for upward deviations and crosses for downward deviations, making it easy to interpret market conditions at a glance.
How to Use Fibonacci Progression With Breaks
To effectively use this indicator in your trading:
- Set Up the Indicator: Add the Fibonacci Progression With Breaks indicator to your chart and adjust the settings according to your preferences and the specific market you’re trading.
- Observe Price Deviations: Watch for significant deviations from the central level, indicated by checkmarks (upward) or crosses (downward).
- Monitor Trend Direction: Use the central level as a reference point. An uptrend is indicated when the central level is higher than its previous value, while a downtrend is shown when it’s lower.
- Look for Breaks: Pay attention to the “break” label, which appears when the price significantly deviates from the central point beyond the user-defined sequence length. This often signals a potential trend change or continuation.
- Use Support and Resistance Levels: The indicator highlights upper and lower extremities from the central level, which can serve as key support and resistance levels for making trading decisions.
Identifying Trends and Reversals
Fibonacci Progression With Breaks excels in helping traders identify both ongoing trends and potential reversal points:
- Trend Identification:
- Uptrend: Look for a series of higher central levels and upward deviations (checkmarks).
- Downtrend: Watch for lower central levels and downward deviations (crosses).
- Reversal Signals:
- Potential upward reversal: A cross appearing after a series of downward movements.
- Potential downward reversal: A checkmark showing up after a series of upward movements.
- Trend Strength: The number of consecutive deviations in the same direction can indicate the strength of the current trend.
The Role of Breaks in Fibonacci Progression
Breaks play a crucial role in this indicator:
- Resetting the Sequence: When a break occurs, the Fibonacci multiplier resets to 1, and a new central level is established at the current closing price.
- Signaling Major Changes: Breaks often indicate significant shifts in market sentiment or the potential for a new trend to emerge.
- Adapting to Volatility: By incorporating breaks, the indicator can adjust to changes in market volatility, maintaining its relevance across different market conditions.
Support and Resistance Levels
The Fibonacci Progression With Breaks indicator provides valuable information about potential support and resistance levels:
- Dynamic Levels: The upper and lower extremities highlighted by the indicator serve as dynamic support and resistance levels.
- Threshold Distance: The indicator shows the threshold distance, which can be used to gauge the strength of support and resistance levels.
- Trading Opportunities: These levels can be used to identify potential entry and exit points for trades, as well as to set stop-loss and take-profit orders.
Practical Applications in Different Markets
While Fibonacci Progression With Breaks can be applied to various markets, its effectiveness may vary:
- Forex Markets: The indicator works well in identifying trends and reversals in currency pairs, especially those with higher volatility.
- Stock Markets: It can be useful for analyzing individual stocks or indices, helping traders spot potential breakouts or trend changes.
- Commodity Markets: The indicator can be valuable in markets like gold or oil, where price movements often follow clear trends.
- Cryptocurrency Markets: Given the high volatility in crypto markets, this indicator can help traders navigate rapid price changes and identify potential reversal points.
Tips for Optimizing Your Trading Strategy
To make the most of Fibonacci Progression With Breaks:
- Combine with Other Indicators: Use it alongside other technical indicators like Moving Averages or RSI for confirmation.
- Adjust Settings for Different Timeframes: Fine-tune the indicator settings based on whether you’re trading on short-term or long-term charts.
- Practice Risk Management: Always use proper stop-loss and take-profit levels, regardless of the indicator’s signals.
- Backtest Your Strategy: Before trading with real money, backtest your strategy using historical data to understand how the indicator performs in different market conditions.
- Stay Informed: Combine technical analysis with fundamental analysis and stay updated on market news that could impact your trades.
Conclusion
Fibonacci Progression With Breaks is a versatile and powerful tool for traders looking to enhance their market analysis and decision-making processes. By highlighting significant price deviations and potential trend changes, this indicator provides valuable insights that can be incorporated into various trading strategies.
Remember that while this indicator can be highly effective, it should not be used in isolation. Combine it with other analytical tools, maintain proper risk management, and continuously educate yourself about market dynamics to maximize your trading success.
Whether you’re a novice trader or an experienced market participant, incorporating Fibonacci Progression With Breaks into your toolkit can offer a fresh perspective on price movements and help you make more informed trading decisions.
Vendor Site – Click Here
| Membership | Yearly Membership |
|---|---|
| Additional Services | Unlock & Decompile |
| Recommended Brokers | Exness Broker, FPMarkets |
| Recommended VPS | FXVM (Low Latency) |
| Youtube Channel | ForexForYou |
| Telegram Channel | Onshoppie Forex EA's & Indicators |
| Telegram Support | Onshoppie Support |
| Installation Guides | Onshoppie Forex Guides |
Brand
Indicator-mt4
Indicator-mt5
Only logged in customers who have purchased this product may leave a review.





Reviews
There are no reviews yet.