Olympia Indicator MT4 For Build 1441+
$9.95
The proven Olympia Indicator EA thrills traders worldwide with consistent profits. Join thousands who’ve revolutionized their forex trading experience.

Description
Table of Contents
- What Is the Olympia Indicator?
- What Is the Olympia Indicator?
- How the EA Builds on the Core Indicator
- Key Inputs and Settings
- Olympia Indicator Strategy Explained
- Buy Signal Checklist
- Sell Signal Checklist
- Risk and Money Management
- Back-Testing the Olympia Indicator EA
- Common Questions
- Final Thoughts
What Is the Olympia Indicator?
Olympia Indicator is an Indicator designed for MetaTrader 4 / MetaTrader 5 that automates the signals generated by the Olympia indicator. Instead of waiting in front of charts for a manual alert, the EA reads the indicator values in real time, places orders, and can manage stops and targets on your behalf.
Key points:
- Runs 24/5 on a VPS or local computer.
- Uses the same blend of moving averages, RSI, and stochastic values that forms the base indicator.
- Filters trades according to user-defined trend and pullback rules.
- Can close trades automatically when opposite conditions appear.
Internal link example: Our complete MT4 EA installation guide walks you through setting up any robot in under 10 minutes.
What Is the Olympia Indicator?
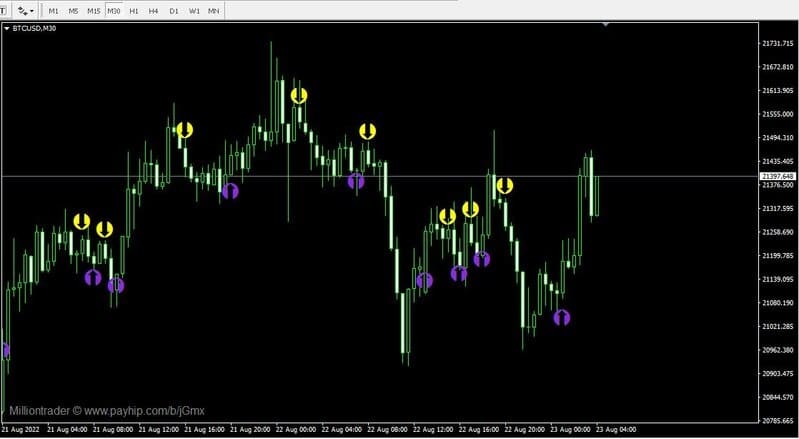
If you are new to the concept, the Olympia indicator is a custom technical analysis tool that overlays a single colored line on the price chart. Behind the scenes it mixes:
- Moving Averages – show the general trend.
- Relative Strength Index (RSI) – measures momentum.
- Stochastic Oscillator – highlights overbought and oversold conditions.
The result is a smoothed line that tends to sit above price in an up-trend and below price in a down-trend. Because it blends three traditional studies, it attempts to remove noise and give a clear directional bias.
External link: You can review the formulas for RSI and stochastic on Investopedia.
How the EA Builds on the Core Indicator
| Feature | Manual Indicator | Olympia Indicator |
|---|---|---|
| Signal Delivery | Visual line changes | Auto trade execution |
| Time in Front of Screen | High | Low |
| Risk Control | Manual | Fixed or ATR-based stops |
| Trade Management | Up to user | EA can trail stops or break even |
| Emotional Bias | Possible | Reduced |
Key Inputs and Settings
When you load the Olympia Indicator, the Inputs tab may include:
| Input Name | Description | Typical Range |
|---|---|---|
Lots |
Fixed lot size per trade | 0.01 – 1.00 |
RiskPercent |
% of account balance to risk | 1 – 3 % |
MA_Period |
Period for base moving average | 20, 50, 100 |
RSI_Period |
RSI look-back | 14 |
Stoch_K / Stoch_D |
Stochastic settings | 5,3 |
Pullback_Pips |
Minimum pullback size before entry | 15 – 50 pips |
StopLoss_Pips |
Static stop distance | 30 – 100 pips |
TakeProfit_Pips |
Static profit target | 60 – 200 pips |
Enable_TrailingStop |
On/off | true / false |
Tip: Always start with the default values on a demo account and tweak slowly.
Olympia Indicator Strategy Explained
The strategy has three simple parts: trend, pullback, confirmation.
- Identify the trend
- If the Olympia line plots above price candles, trend = up.
- If the line plots below price candles, trend = down.
- Wait for a pullback
- A pullback is a move in the opposite direction of the trend that often gives better entry prices.
- Traders typically wait until price touches an internal moving average such as the 20-EMA.
- Confirm with Olympia line
- For a long trade, the line should dip into an oversold area (often the lower 20 zone of RSI) and turn upward.
- For a short trade, the line should spike into an overbought area (upper 80 zone) and roll downward.
Because the indicator repaints, confirmation needs a bar-close rule: only accept the signal after the candle closes.
Buy Signal Checklist
- Market structure shows higher highs & higher lows on H1 or H4.
- Olympia line sits above the chart for at least three consecutive candles.
- Price pulls back 30–50 pips toward the line.
- On pullback, RSI < 30 and stochastic < 20.
- At candle close, Olympia line turns green or slopes up.
- EA opens a buy with:
- Stop Loss: 1 ATR below recent swing low.
- Take Profit: 2 × risk or next resistance zone.
Example pair: EUR/USD, timeframe H1.
Sell Signal Checklist
- Market structure shows lower highs & lower lows on H1 or H4.
- Olympia line sits below the chart for at least three consecutive candles.
- Price retraces 30–50 pips upward toward the line.
- On retrace, RSI > 70 and stochastic > 80.
- At candle close, Olympia line turns red or slopes down.
- EA opens a sell with:
- Stop Loss: 1 ATR above recent swing high.
- Take Profit: 2 × risk or next support zone.
Risk and Money Management
Even the best Expert Advisor has draw-downs. Follow these points:
- Risk per trade: Keep it at or below 2 % of account equity.
- Max open trades: Limit to 3 to avoid correlation risk.
- Weekly loss cap: Pause this if equity drops by 5 %.
- VPS / Stable internet: Prevent missed exits due to connection drops.
- Diversification: Test on no more than two pairs until consistent.
External link: For an overview of position sizing, see BabyPips position size calculator.
Back-Testing the Olympia Indicator
Before going live, run a historical test:
- Open MetaTrader Strategy Tester (
Ctrl+R). - Select Olympia Indicator and a currency pair.
- Use Every Tick model for best accuracy.
- Test at least 2 years of data.
- Review metrics:
- Profit Factor > 1.5
- Max Draw-Down < 20 %
- Sharpe Ratio > 0.2
If the EA passes, move to a demo account for four weeks. Only then consider a small live allocation.
Common Questions
Is the Olympia Indicator free?Some versions are free; others require a license. Check the developer’s page or the MQL5 market for details.
Does this work on crypto or indices?While built for forex, you can test on other CFD symbols. Adjust stop settings, as volatility differs.
Why did this skip a signal?Possible reasons:
- Spread larger than the EA’s maximum.
- Pullback size did not meet your
Pullback_Pips. - Indicator repainted, invalidating the signal at candle close.
Final Thoughts
The Olympia Indicator offers a hands-off way to trade the blended Olympia indicator rules. Keep your expectations realistic: repainting indicators can give mixed signals, and no algorithm wins 100 % of the time. Combine this with solid risk control, periodic performance reviews, and a clear understanding of trend and pullback logic.
Ready to test it? Start on a demo account today, monitor the stats for four weeks, and share your findings in the comments below. Happy trading!
Vendor Site – Private
| Membership | Yearly Membership |
|---|---|
| Additional Services | Unlock & Decompile |
| Recommended Brokers | Exness Broker, FPMarkets |
| Recommended VPS | FXVM (Low Latency) |
| Youtube Channel | ForexForYou |
| Telegram Channel | Onshoppie Forex EA's & Indicators |
| Telegram Support | Onshoppie Support |
| Installation Guides | Onshoppie Forex Guides |
Brand
Indicator-mt4
Only logged in customers who have purchased this product may leave a review.





Reviews
There are no reviews yet.